
Draw Output of a MATLAB Code on a Graph
$29.00$19.001424 reads
Question
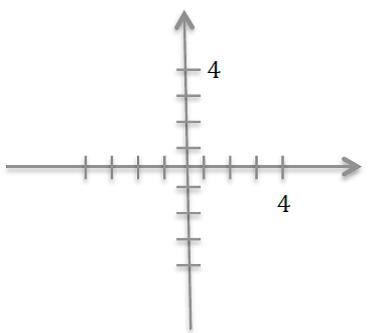
Draw the output of the following MATLAB code on the graph on the right:
r = 4;
ts = 0:45:360;
xs = r * cosd(ts);
ys = r * sind(ts);
plot( xs, ys, '+-k');
axis equal;
Summary
This question belongs to MATLAB software and discusses about to draw given MATLAB output on a graph.
Answer is in MATLAB format
Related Solutions
How To Find Current Through A Resistor And Capacitor In Series CoCalculation of Impedance Using MATLABPortfolio Valuation Using MATLABCalculation of Correlation Coefficient Between the Class Label UsWhat Happens To The Brightness Or Power Of The Identical Light BuCalculate Magnetic Field Of Wire Wrapped Inside Cylinder
Recently Uploaded Solutions
Write an Essay on the Importance of Public RelationsWrite an essay on the positive impact of shareholder power on bonWrite An Essay On What You Want From Work And How To Achieve ItWrite an essay/report on Marketing Mix OrientationWrite an interview structure about poultry litter convert to bio Write Article Reflection On The Article “Improving Teaching And
Most Downloaded Solutions